If you’ve ever thought “we need a Google Analytics agency to make sense of our content,” this guide is your faster, cheaper path. In about an afternoon, you’ll build a GA4 content dashboard that surfaces real KPI insights, ties posts to revenue, and powers better editorial decisions.
You’ll get a clear setup checklist, the exact events and dimensions to track, step-by-step reporting in GA4, deeper Explorations, optional executive views in Looker Studio, and a lightweight operating routine. Along the way, we’ll show how SEOsolved pairs with this dashboard to accelerate rankings and ROI.
Why this GA4 content dashboard beats hiring a Google Analytics agency
Definition: A GA4 content dashboard is a curated set of GA4 reports that maps content engagement to conversions and revenue using custom content dimensions (e.g., content_type, author, topic_cluster) and standardized KPIs.
Instead of outsourcing analysis to a google analytics agency, you’ll build a self-serve analytics view your team can trust. It reduces dependency, cuts costs, and increases speed-to-insight for every published article.
Criteria | Agency | Your GA4 Content Dashboard |
|---|---|---|
Cost | Retainers + change requests | Free with GA4; 1–3 hours to build |
Speed | Days to weeks for updates | Minutes; you control the Library |
Control | Mediated via briefing | Direct access to events, dimensions, and cards |
Fit for Content Teams | Generalized reports | Tailored to content KPIs and taxonomy |
Scalability | Pay per scope | Add pages, clusters, authors on demand |
Bottom line: you’ll get agency-grade clarity on content performance, with less friction and more agility.
Prerequisites and setup checklist (before you build)
Confirm your GA4 foundation so reporting is clean and comparable. Follow these steps:
Create or verify your GA4 property and web data stream. Add the Google tag sitewide via gtag or Google Tag Manager. See Google’s setup guide for details.
Confirm Admin settings: correct property name, default reporting identity, and data retention.
Set your time zone to United States and currency to USD for consistent reporting.
Enable Enhanced Measurement on the web stream (page views, scrolls, outbound clicks, site search, video engagement).
Ensure DebugView works (use GTM Preview or GA Debugger) and that events appear in Realtime.
Define key conversions (e.g., newsletter signup, demo request, trial start, download) and mark them as conversions in GA4.
Confirm cross-domain measurement where relevant (e.g., marketing site → app subdomain or payment domain).
Review data filters (internal traffic, developer traffic) so content reports reflect true audience behavior.
Map content metadata you’ll pass on page_view (e.g., content_type, author, topic_cluster).
Document your settings in a simple changelog for governance.
Helpful references: Google’s GA4 setup guide and a primer on GA4’s event model from the University of Minnesota’s U of M article.
Define your content measurement plan: KPIs, taxonomy, and naming
Decide what “good” looks like before you build the dashboard. For google analytics for bloggers and B2B teams alike, start here:
KPIs: engaged sessions, engagement rate, average engagement time, conversions, conversion rate, and revenue attributed to content.
Taxonomy: structure content by content_type (blog, guide, landing), author, and topic_cluster (your SEO content group). GA4 Content groups help you bucket pages for reporting.
Naming conventions: keep values short, consistent, and case-normalized (e.g., topic_cluster = “analytics”, not “Analytics”/“analytics” variations).
Good taxonomy improves both user experience and measurement. For more on SEO taxonomy, see SE Ranking’s SEO taxonomy guide and Boostability’s note on clear, consistent categories.
Configure GA4 to capture the right content signals
GA4 is event-based, so a few event and parameter choices unlock powerful content reporting.
Enable and verify enhanced measurement (scrolls, video, outbound clicks)
In Admin → Data Streams → Web → Enhanced measurement: toggle on scrolls, video engagement, and outbound clicks.
Use DebugView to confirm events like
scroll(90% threshold),video_start/video_complete, andoutbound_clickappear with expected parameters.If you need granular scroll depth or more accurate funnels, see Analytics Mania’s scroll depth guide.
Add content metadata to page_view via event parameters and register dimensions
Pass parameters on page_view: via GTM or gtag, include
content_type,author, andtopic_clusterwith every page_view.Register custom dimensions: Admin → Custom definitions → Create custom dimension for each parameter (scope: Event).
Check population: Verify values appear in Realtime and populate in standard reports after processing.
Avoid cardinality issues: keep values concise and consistent. Consider rollups (e.g., “analytics”, “ecommerce”).
Use Google’s reference on available GA4 dimensions and metrics to ensure you choose the right scope and definitions.
Define and prioritize content conversions
Mark the few actions that truly matter to your content-to-conversion model:
Newsletter or content offer signup
Demo or trial request
High-intent clicks (pricing, contact)
Download or add-to-cart, if relevant
Connect pathways by using landing page, page path, and topic_cluster in funnels (more below).
Standardize UTMs for content promotion
Set one UTM schema so your dashboard can segment by source/medium and campaign reliably.
Parameter | Rule | Example |
|---|---|---|
utm_source | Channel platform | newsletter, linkedin, x, facebook |
utm_medium | Channel type | email, social, cpc |
utm_campaign | Promotion theme | q4_launch, guide_ga4 |
utm_content | Variant for A/B | hero_cta_a, hero_cta_b |
Build your GA4 Content Dashboard in Reports (step by step)
We’ll use GA4’s Library to create a dedicated Content collection and an Overview page with the exact cards decision-makers need. For visual guidance on Collections, see MeasureSchool’s walkthrough on GA4 dashboards.
Create a Content collection and Overview in Library
Go to Reports → Library (bottom left).
Click “Create new collection” → Name it “Content”.
Add a new Overview report; pin it to the top of the collection.
Publish the collection so it appears in left navigation for stakeholders.
Add KPI cards and tables that matter
Include the KPIs leadership cares about and the tables analysts use daily. Reference GA4 metric definitions at MeasureSchool’s GA4 metrics guide and AgencyAnalytics’ metric overview.
KPI cards: engaged sessions, engagement rate, average engagement time, conversions, revenue per page.
Tables:
By page: Landing Page with engagement and conversions (see RW Digital’s Landing Page report primer).
By topic_cluster: roll up content performance by theme for portfolio decisions.
By author: identify writing styles and topics driving conversions.
Trend cards: sessions and conversions over time to detect seasonality and campaign lift.
Engagement notes: “Average engagement time” is a strong proxy for content depth (see SEMrush’s note on content performance).
Save reusable comparisons (organic vs. social, new vs. returning)
Open your Content Overview; click “Add comparison”.
Create a source/medium filter for organic traffic vs. social traffic.
Create an audience comparison for new vs returning users.
Save for quick toggling; you won’t need to rebuild segments each time.
Deep-dive content analysis with Explorations
Explorations answer the “why” behind performance. Remember: in GA4, metrics quantify performance and dimensions add context; learn the difference in DashThis’s quick primer on metrics vs dimensions.
Free-form: the content performance grid
Build a Free-form exploration.
Rows: Page path and screen class; add topic_cluster as a secondary dimension.
Values: engaged sessions, engagement rate, average engagement time, conversions, conversion rate.
Sort by conversions, then scan for posts with strong engagement but low conversion (prime optimization targets).
Funnel: content view → key conversion
Create a Funnel exploration: Step 1 = Landing on content page (filter topic_cluster = your target).
Optional micro-steps: click CTA, view pricing, form start.
Final step: conversion (e.g., signup or demo request).
Analyze drop-offs and test tighter CTAs or inline forms.
Path: where users go after reading
Open a Path exploration from a popular content page or topic_cluster.
Identify next pages and loops; add internal links toward pricing, demo, or high-converting posts.
Re-run after changes to verify lifts in next-step clicks and conversions.
Optional: Executive reporting in Looker Studio
If leaders want a shareable view, mirror your GA4 content dashboard in Looker Studio.
Connect GA4 and build content scorecards
Use the GA4 connector; add scorecards for engaged sessions, conversions, and revenue.
Include drop-down filters for topic_cluster and author.
Add time series for sessions and conversions with YoY comparison.
Blend supporting data sources when needed
Optional blend with CRM (opportunities, pipeline) or paid media for attribution context.
Keep the story content-first: content → engagement → pipeline → revenue.
QA, governance, and ongoing google analytics optimization
Great dashboards are governed, not just launched. Build a light but reliable QA and governance loop for long-term google analytics optimisation.
Validate with DebugView and Realtime
Trigger key events and confirm parameters arrive with correct values (content_type, author, topic_cluster).
Check new custom dimensions populate in reports after processing (may take 24 hours).
Data quality checks, annotations, and alerts
Monthly audits: parameters present, UTMs conform, conversions firing.
Annotations: note major releases and campaigns so trends have context.
Alerts: set email alerts for sudden drops in traffic, conversions, or data collection.
Performance and scale: thresholds, sampling, BigQuery
Reduce high-cardinality dimensions (e.g., consolidate topic tags into topic_cluster).
Use rollups in standard reports; switch to Explorations when detailed views are thresholded.
Consider BigQuery export for unsampled analysis and advanced modeling as you scale.
Review Google’s reference on dimensions/metrics and population.
Make better content decisions with your GA4 dashboard
Turn insight into action. Use this dashboard to refine your editorial calendar and capture compound gains.
Prioritize updates for compounding gains
High engagement, low conversion: strengthen CTAs, add demo links, test inline forms.
Low engagement, solid conversion: improve intro hooks, subhead clarity, and readability.
Cluster view: double down on winning topic_clusters; merge or sunset underperformers.
Internal linking and CTA experiments
Use Path explorations to identify “next best page” and add in-line links accordingly.
Test CTA placement and copy on top posts; measure in Funnels.
For strategic planning, see our guide on customer journey mapping.
Reporting cadence for stakeholders
Weekly: top movers, new posts’ early engagement, anomalies.
Monthly: cluster performance, conversion trends, experiments and results.
Quarterly: content pruning, pillar refreshes, and roadmap updates.
Troubleshooting common GA4 content reporting issues
Content dimensions not populating
Verify parameter names exactly match registered custom dimensions (case-sensitive).
Confirm scope = Event for page_view parameters.
Check in DebugView and Realtime that values are present.
Allow processing time; then test in a simple Exploration.
Conversions not attributed to content
Review attribution settings and lookback windows.
Check session timeout; very short timeouts can fragment journeys.
Fix cross-domain tracking to preserve session continuity.
Use Landing Page + conversion path reports to confirm flow.
Thresholding and cardinality headaches
Minimize high-cardinality dimensions; use topic_cluster rollups.
Use Explorations to avoid aggregated thresholds when possible.
Export to BigQuery for full-fidelity analysis when scale grows.
How SEOsolved amplifies your GA4 content workflow
Building the dashboard is half the win. Filling it with consistent, high-quality content is the other half. SEOsolved automates what usually takes a team and 80+ hours a month.
Turns your URL into a strategy: discovers 500+ ranking keywords and builds a content roadmap.
Scales production: generates 30–60 in-depth, SEO-optimized articles monthly.
Credible by design: cites reliable sources and aligns to search intent.
Operates in minutes per week: approve, publish, and measure inside your GA4 dashboard.
Map SEOsolved content clusters to GA4 dimensions
Use SEOsolved’s topic clusters and briefs as your topic_cluster values. Segment by funnel stage (awareness, consideration, decision) to see which clusters drive conversions and revenue.
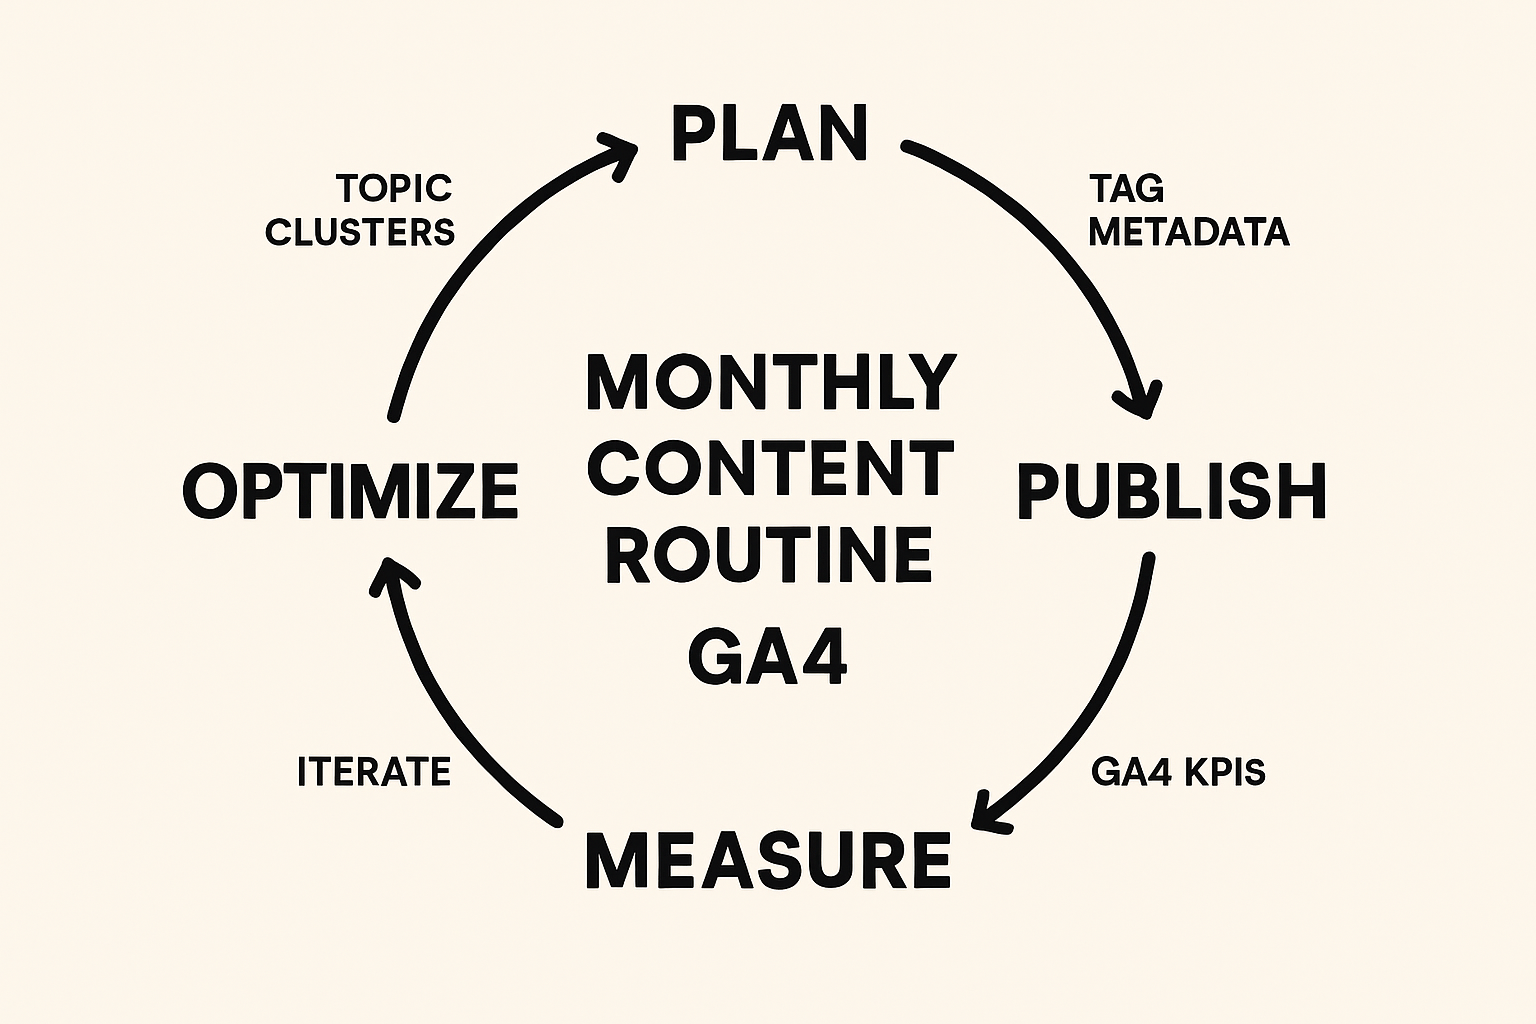
Monthly operating routine: from plan to results
Publish new SEOsolved articles and tag metadata (content_type, author, topic_cluster).
Review GA4 KPIs by page and cluster; note winners and gaps.
Run Funnel and Path explorations; ship quick CTA and internal-link tests.
Iterate briefs for next month to compound gains.
Get started
Ready to automate your content engine and pair it with the GA4 dashboard above? Stat Ranking Today.
FAQ
What is a GA4 content dashboard?
A focused set of GA4 reports and custom dimensions that shows how content drives engagement, conversions, and revenue, organized by content type, author, and topic cluster.
Do I need Google Tag Manager to build this?
No, but GTM makes passing content parameters (content_type, author, topic_cluster) and testing with Preview much easier than editing site code.
How long until I see data in custom dimensions?
Realtime shows events immediately, but standard reports often need several hours to 24 hours to populate new custom dimensions.
Which KPIs matter most for content?
Engaged sessions, engagement rate, average engagement time, conversions, conversion rate, and revenue per page. Add cluster-level rollups for portfolio decisions.
When should I use BigQuery?
When you hit thresholding or need unsampled, detailed analysis across high-cardinality dimensions, cohorting, or advanced attribution.