
Most teams “track content” but struggle to prove profit. This playbook shows a practical way to quantify returns, cut waste, and forecast growth—without analyst gymnastics.
We’ll define ROI for content, map goals to content marketing KPIs, capture true costs, convert outcomes into dollars, choose attribution that fits your journey, and ship a ready-to-use spreadsheet. You’ll also see where SEOsolved speeds up time-to-value.
What “measuring content marketing ROI” really means
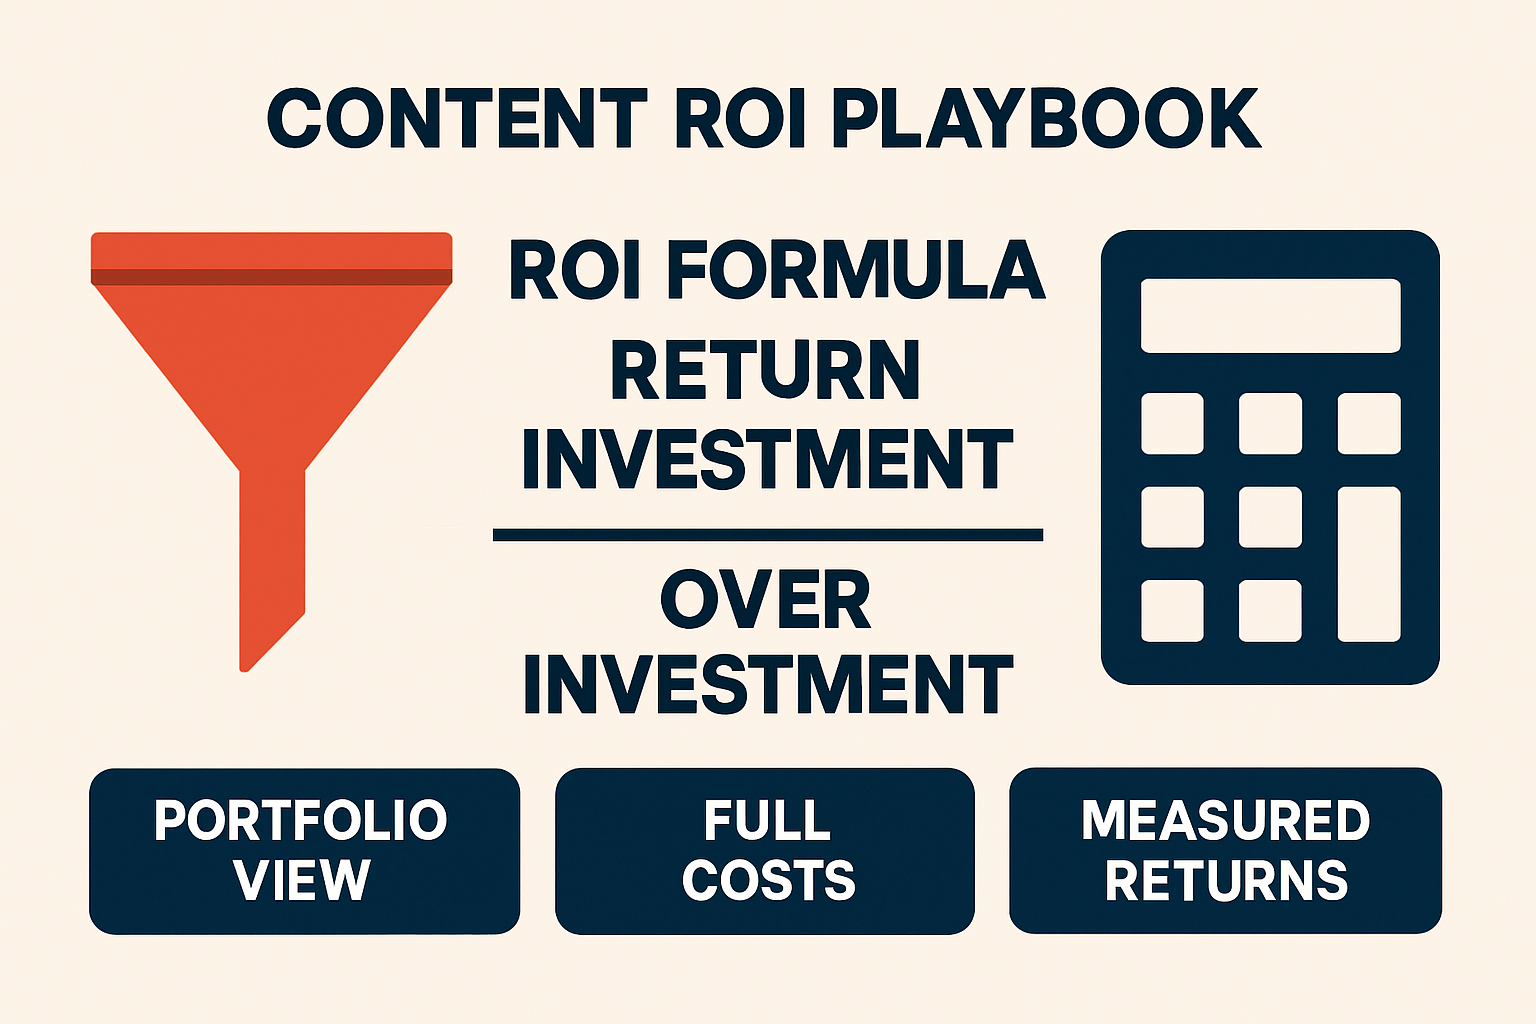
Content marketing ROI is the financial return generated by your content portfolio relative to the fully loaded investment required to produce, distribute, and maintain it.
Baseline ROI formula: ROI% = (Return − Investment) / Investment × 100
- Portfolio vs. page-level: Make decisions from the portfolio (topics, clusters, channels). Then drill down to assets for optimization. Page-level volatility can mislead.
- Scope: Include acquisition, retention, and expansion effects. Support content and FAQs that reduce churn or tickets belong in the model.
- Consistency: Use one ROI definition across your org so trends are comparable month-to-month.
For reference, the simple equation above is aligned with standard guidance on ROI calculation used across marketing finance sources.
Choose objectives and content marketing KPIs before you measure
Start with business outcomes, not vanity metrics. Tie goals—pipeline, revenue, retention—to a small, balanced set of content marketing KPIs so your ROI reflects money earned, not clicks alone. Many experts recommend tracking a concise KPI set across the funnel to avoid data overload.
Match KPIs to funnel stages
- Awareness (TOFU): organic sessions, new users, ranking keywords in top 10, SERP share.
- Consideration (MOFU): engaged sessions, content-to-lead conversion rate, demo/ebook signups, assisted conversions.
- Conversion (BOFU): leads to pipeline value, closed-won revenue, CAC, and payback period.
Framing KPIs by TOFU → MOFU → BOFU aligns measurement to the buyer journey and clarifies where content is working—and where it leaks.
Translate KPIs into dollars
- Lead value (B2B): Lead Value = ACV × Close Rate × Qualification Rate × Gross Margin.
- Ecommerce order value (B2C): Net Revenue = Orders × Average Order Value (AOV) × Gross Margin.
- LTV impact: If content reduces churn or increases expansion, model the uplift: LTV Uplift = Baseline LTV × % Improvement.
- Support deflection: Value = Tickets Avoided × Cost per Ticket.
Set your measurement window
- Short sales cycles (B2C): 30–60 day windows for conversion and 90 days for retained value.
- Long cycles (B2B): 90–180 day windows; report monthly with a rolling 90-day lag to avoid undercounting.
- Compounding content: Allow 3–6 months for organic ramp-up and 9–12 months for mature baseline performance.
Pick windows that match your conversion latency, then keep them consistent so YoY and QoQ comparisons remain trustworthy.
Step 1: Capture the full cost of your content investment
Underestimating cost inflates ROI. Inventory all expenses per asset and per month.
Direct production costs
- Writing & editing: per-article fees or internal time cost.
- Design & video: thumbnails, diagrams, animations, post-production.
- Subject matter expert time: interviews, reviews.
Distribution and tooling
- Promotion: email service, social scheduling, paid boosts, syndication.
- Software subscriptions: SEO platforms, analytics, CMS plugins. Allocate proportionally to content usage.
- Internal enablement: sales collateral formatting, gated asset hosting.
Labor time valuation
- Loaded hourly rate: (Salary × 1.3–1.6) / 2080 hours ≈ fully loaded hourly cost.
- Asset cost: Sum of hours × loaded rates across roles (strategist, writer, designer, PM).
- Opportunity cost: If a senior IC shifts from CRO to content, note the foregone revenue impact separately for planning.
Ongoing maintenance and refresh
- Refresh cycles: updates to facts, keywords, internal links, and CTAs to counter content decay.
- SEO optimization: schema, FAQ updates, new examples, image compression.
- Rehosting & compliance: accessibility, legal, brand updates.
Plan refreshes into your budget. For a maintenance strategy that compounds, see our guide to an evergreen content strategy.
Step 2: Quantify financial returns from content
Convert tracked outcomes into revenue with clear, agreed assumptions. Document sources (analytics, CRM, ecommerce) and keep them stable.
Lead-gen model (B2B)
- Inputs: MQLs from content, MQL→SQL rate, SQL→Closed-Won close rate, ACV, gross margin.
- Pipeline value: Pipeline = MQLs × MQL→SQL × SQL→Opp × ACV.
- Expected revenue: Revenue = Pipeline × Close Rate × Gross Margin.
- Lag: Apply your average days from first touch to close to the attribution window.
Ecommerce model (B2C)
- Sessions to orders: Orders = Sessions × Conversion Rate.
- Gross revenue: Orders × AOV.
- Net return: Gross Revenue × Gross Margin − Content Costs.
Retention and LTV uplift
- Churn reduction: Model the change in churn for cohorts exposed to onboarding or help content.
- Expansion: Track add-on adoption influenced by educational content.
- Support deflection: Attribute value to docs and FAQs that reduce ticket volume.
Assisted conversions and view-through
Content often assists other channels. Use consistent rules so you recognize multi-touch influence without double-counting. Linear or position-based models can offer a balanced view, especially in longer journeys.
Step 3: Pick an attribution model and time window
Choose a pragmatic model you can maintain. Sophisticated but brittle beats simple and consistent. Aim for portfolio-level accuracy first.
- First touch: Credits discovery. Good for top-of-funnel strategy.
- Last touch: Credits the final action. Useful for CRO, but underweights earlier influence.
- Linear: Equal credit across touches. Works well when journeys are complex.
- Time decay: More credit to recent touches—helpful with short decision windows.
- Position-based/W-shaped: Emphasizes first interaction, MQL, and opportunity creation to reflect key milestones.
Portfolio-level vs. page-level
Attribute at the cluster or program level (e.g., “Analytics for SaaS” hub) to guide investment, then use page-level analysis for optimization. This prevents overfitting to single posts.
Time-lag considerations
Set lookback windows to match conversion latency. For example, if median time from first visit to demo is 21 days and to close is 74 days, set 30/90 day views for reporting cadence.
Avoid double-counting
- Create a hierarchy: direct conversions override assists.
- Deduplicate cross-channel sessions when the same user converts within the window.
- Lock your rules and document them in your analytics governance.
Step 4: Calculate ROI with clear, worked examples
Use the same math across models so stakeholders can compare apples-to-apples.
B2B SaaS example
Scenario: Monthly content program generates 400 MQLs attributed on a 90-day lag. MQL→SQL 35%, SQL→Opp 60%, Close Rate 25%, ACV $18,000, Gross Margin 80%. Monthly content cost: $28,000.
- SQLs = 400 × 0.35 = 140
- Opps = 140 × 0.60 = 84
- Closed-Won = 84 × 0.25 = 21
- Gross Revenue = 21 × $18,000 = $378,000
- Net Revenue (margin) = $378,000 × 0.80 = $302,400
- Net Return = $302,400 − $28,000 = $274,400
- ROI% = $274,400 / $28,000 ≈ 981%
- Payback: If spend is even monthly, this month is already net-positive; cumulative payback occurs within the first month.
Note: Swap in your actual ACV, conversion rates, and margin. Report with a 90-day delay to reflect cycle time.
Ecommerce example
Scenario: Content drives 120,000 sessions in 45 days. CVR 2.2%, AOV $72, Gross Margin 62%. Monthly content cost: $20,000.
- Orders = 120,000 × 0.022 = 2,640
- Gross Revenue = 2,640 × $72 = $190,080
- Net Revenue = $190,080 × 0.62 = $117,849.60
- Net Return = $117,849.60 − $20,000 = $97,849.60
- ROI% ≈ 489%
- Payback: If content spend is even, payback occurs well within the 45-day window.
Payback period and break-even
- Payback (days): Cumulative Net Return crosses zero. Track by week or month.
- Break-even: Returns = Costs. Useful as a milestone for new content programs.
- Cohort view: Track content cohorts (by publish month) to see how returns mature over time.
Ready to implement faster? SEOsolved can research keywords, map a content roadmap, and draft SEO-optimized articles in under an hour so you can model ROI sooner. Stat Ranking Today.
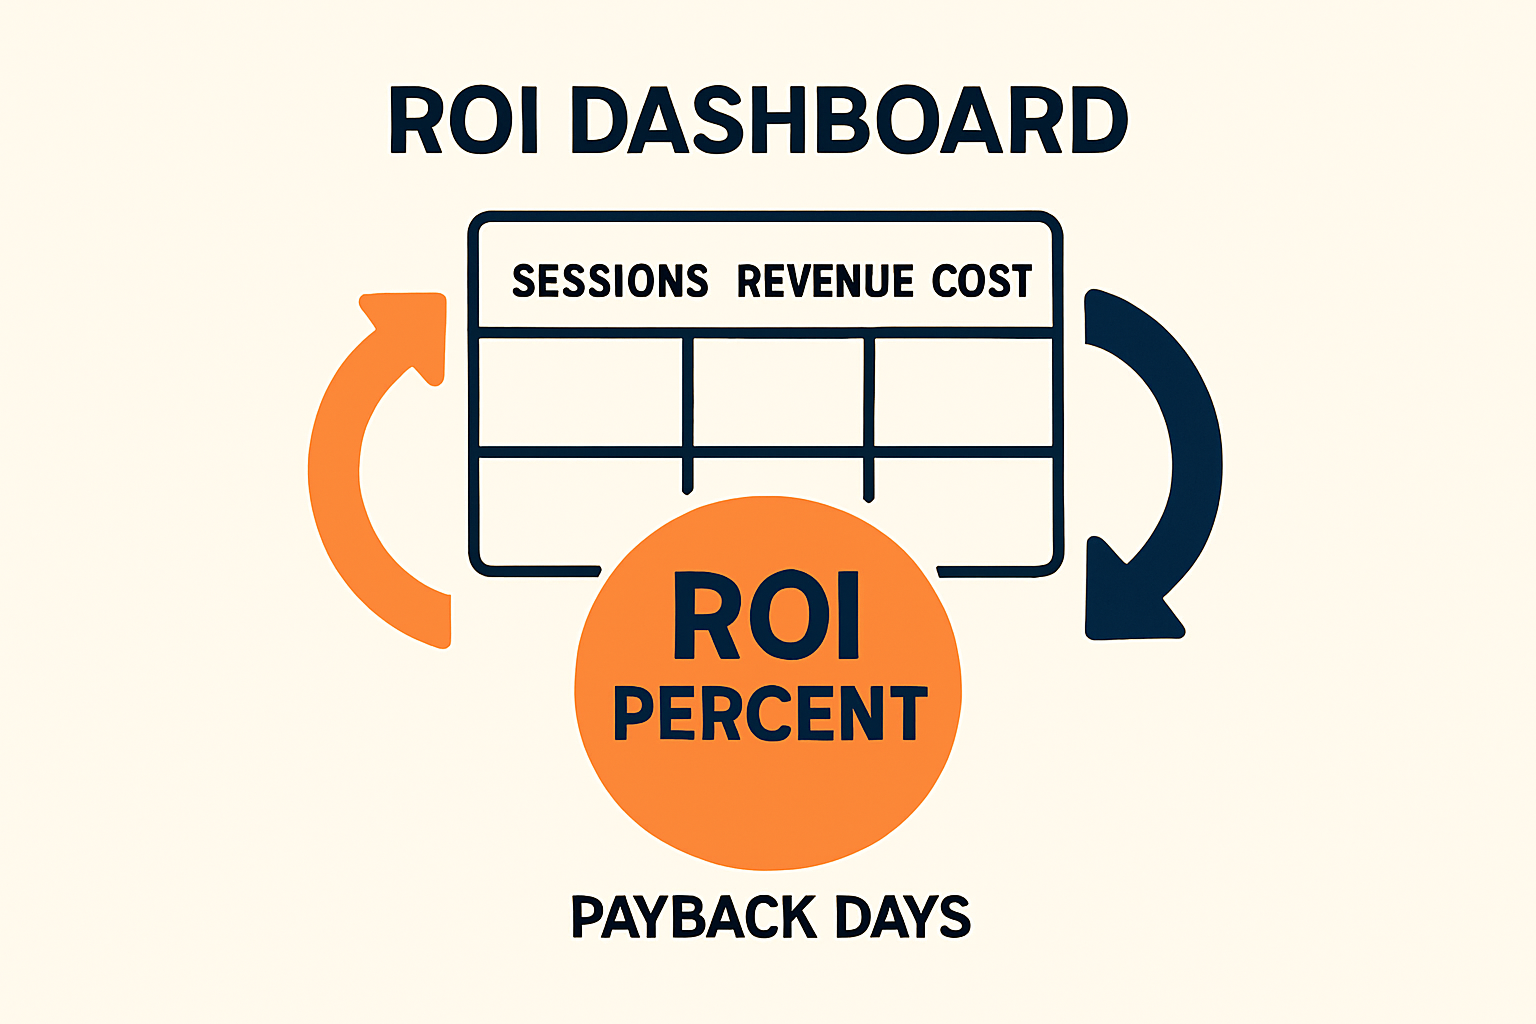
Build your ROI dashboard (spreadsheet schema)
Copy these fields and formulas into Google Sheets/Excel. Pair it with your GA4 and CRM exports. For GA4 setup tips, see how to build a GA4 content dashboard.
Core data fields
- Asset, URL, Publish Date, Topic Cluster, Funnel Stage
- Sessions, Engaged Sessions, Leads, Orders
- MQLs, SQLs, Opps, Closed-Won
- Revenue (Gross), Gross Margin %, Revenue (Net)
- Cost (Production), Cost (Distribution/Tools), Cost (Maintenance), Total Cost
- Net Return, ROI%, Payback (days), Attribution Model, Lookback Window
Essential formulas
- Lead Value (cell): =ACV*CloseRate*QualRate*GrossMargin
- Revenue (Net): =RevenueGross*GrossMargin
- Total Cost: =ProdCost+DistCost+MaintCost
- Net Return: =RevenueNet-TotalCost
- ROI%: =IF(TotalCost=0,0,NetReturn/TotalCost)
- Payback (days): =XLOOKUP(0,CumulativeNetReturnRange,DateRange,"")
Reporting cadence and QA
- Cadence: Weekly for early detection, monthly for board-ready summaries.
- Spot checks: Validate sampled conversions back to CRM or checkout.
- Variance reviews: Investigate big swings in CVR, AOV/ACV, or margin before acting.
Benchmarks and targets to sanity-check your ROI
Benchmarks vary by industry, pricing, and channel mix. Use ranges as directional targets, not absolutes, and calibrate with your historicals.
B2B lead-gen baselines
- Track MQL rate from content, SQL rate, and win rate by source. Focus on LTV:CAC and payback.
- Healthy programs trend toward improving lead quality and shortening sales cycles as content matures.
Ecommerce baselines
- Watch CVR by intent segment and device; pair with AOV and margin thresholds.
- Expect compounding traffic from evergreen categories; protect margin during promos.
Early-stage vs. mature programs
- Early-stage: Higher CAC, slower payback, heavier reliance on paid distribution.
- Mature: Improved internal linking, stronger SERP intent alignment, lower unit costs, higher assisted-conversion share.
Improve ROI quickly: levers to pull this quarter
Prioritize changes that lift conversions or reduce costs without hurting quality.
Increase returns
- On-page CRO: test headline clarity, form friction, and proof near CTAs.
- Internal linking: connect TOFU posts to BOFU pages and demos; automate with a smart system—see Automated Internal Linking.
- Search intent alignment: rewrite intros and H2s to match SERP patterns; add FAQs for snippet wins.
Reduce costs
- Standardize briefs & templates: decrease revisions and accelerate throughput.
- Leverage AI where it helps: outline, research synthesis, style QA. For the bigger picture, explore our SEO automation ROI guide.
- Replicable design system: reusable diagrams and components reduce per-asset cost.
Refresh and repurpose
- Historical optimization: update decaying winners; add new data, examples, and FAQs.
- Repurpose: turn long posts into checklists, comparison tables, and scripts for short video.
Prioritize high-intent topics
- Focus on bottom-funnel keywords that imply urgency to buy or talk to sales.
- Cluster around product-led use cases to raise close rates and ACV.
Where SEOsolved fits in your ROI plan
SEOsolved accelerates ROI by automating the slowest parts of the process with an AI-powered workflow that stays grounded in business outcomes.
- Discover high-ROI keywords and gaps: Analyze competitors, surface hundreds of ranking opportunities, and quantify intent—so you target revenue keywords first.
- Build a tailored content roadmap: Generate a sequenced plan tied to funnel stages and costs to forecast returns with less guesswork.
- Generate SEO-optimized articles fast: Create source-backed drafts in as little as 30 minutes to reduce production time and cost without sacrificing quality.
- Rank across Google, ChatGPT, and more: Expand discoverability across surfaces for compounding organic returns.
- Simple workflow to measure ROI: Export articles, tag campaigns, and track in your dashboard for clean attribution.
Want a strategic primer? Read our AI SEO Strategy guide. Then put it into practice. Stat Ranking Today.
ROI calculator template: column layout and formulas
Use this blueprint in Sheets/Excel to calculate measuring content marketing ROI consistently.
Column layout
- Channel, Campaign, Intent, Topic Cluster, Asset, URL
- Publish Date, Lookback Start, Lookback End
- Sessions, Engaged Sessions, Leads, Orders
- MQLs, SQLs, Opps, Closed-Won
- ACV/AOV, CVR, Close Rate, Gross Margin %
- Revenue Gross, Revenue Net, Cost Prod, Cost Dist/Tools, Cost Maint, Total Cost
- Net Return, ROI %, Payback Days, Attribution Model, Notes
Sample formulas
- Revenue Net: =RevenueGross*GrossMargin
- Net Return: =RevenueNet-TotalCost
- ROI %: =IFERROR(NetReturn/TotalCost,0)
- Lead Value (B2B): =ACV*CloseRate*QualRate*GrossMargin
- Orders (B2C): =Sessions*CVR
- Payback Days: Find first date where cumulative Net Return ≥ 0 (e.g., INDEX(DateRange,MATCH(TRUE,CumulativeNetReturn>=0,0)))
Data hygiene checklist
- Consistent UTM conventions across channels and campaigns.
- Align date ranges (publish to lookback end) with your sales cycle.
- Document margin assumptions; review quarterly.
- Lock attribution rules and keep a change log.
Common pitfalls that distort ROI (and quick fixes)
Measuring the wrong KPIs
Fix: Replace vanity metrics with funnel-aligned KPIs tied to revenue or efficiency. Limit to 5–8 metrics across stages and keep a KPI scorecard.
Ignoring maintenance costs
Fix: Add refresh and tooling to Total Cost. Track content decay and schedule updates accordingly.
Too-short attribution windows
Fix: Match lookback windows to time-to-demo and time-to-close. Report with lag to avoid undercounting.
Double-counting assists
Fix: Establish assist rules and a deduplication hierarchy. Document in your analytics governance and audit monthly.
Next steps: put your ROI plan into action
1) Define objectives and KPIs. 2) Capture full costs. 3) Convert outcomes to dollars. 4) Choose attribution and windows. 5) Calculate ROI and payback with our template. 6) Optimize levers for quick wins.
Quick start checklist
- Pick your KPI stack across TOFU/MOFU/BOFU and lock definitions.
- Stand up the spreadsheet schema and paste formulas.
- Export GA4 and CRM data; tag content campaigns consistently.
- Apply linear or position-based attribution; set 30/60/90 and 6–12 month views.
- Run B2B or B2C example math with your numbers to set targets.
- Prioritize 5 refreshes, 5 internal link upgrades, and 5 BOFU topics for this quarter.
- Schedule weekly QA and monthly variance reviews.
Accelerate with SEOsolved
Automate strategy and production so you can focus on conversion and ROI. SEOsolved discovers high-ROI keywords, builds your roadmap, and generates source-backed articles fast. Export, tag, track—repeat. Stat Ranking Today.
FAQ
What is the formula for measuring content marketing ROI?
ROI% = (Return − Investment) / Investment × 100. Use net revenue after margin for the Return.
Which content marketing KPIs matter most?
Track a small set across the funnel: organic sessions, content-to-lead CVR, pipeline/revenue from content, and payback/CAC.
How long should my attribution window be?
Match it to your sales cycle. Many B2B teams use 90–180 days; ecommerce often uses 30–60 days.
Can I measure retention and support impact?
Yes—model churn reduction, expansion revenue, and support ticket deflection as part of Return.
Do I measure at the page or portfolio level?
Portfolio for budgeting and strategy; page-level for optimization and experiments.