
Executives don’t buy rankings—they buy revenue. This guide shows how to use SEO analytics tools to connect visibility to pipeline and closed-won deals in 2026. You’ll learn the metric hierarchy, the right stack (free and paid), the event/UTM blueprint, and a forecasting model that translates ranking gains into dollars.
Introduction: From Traffic to Revenue Proof
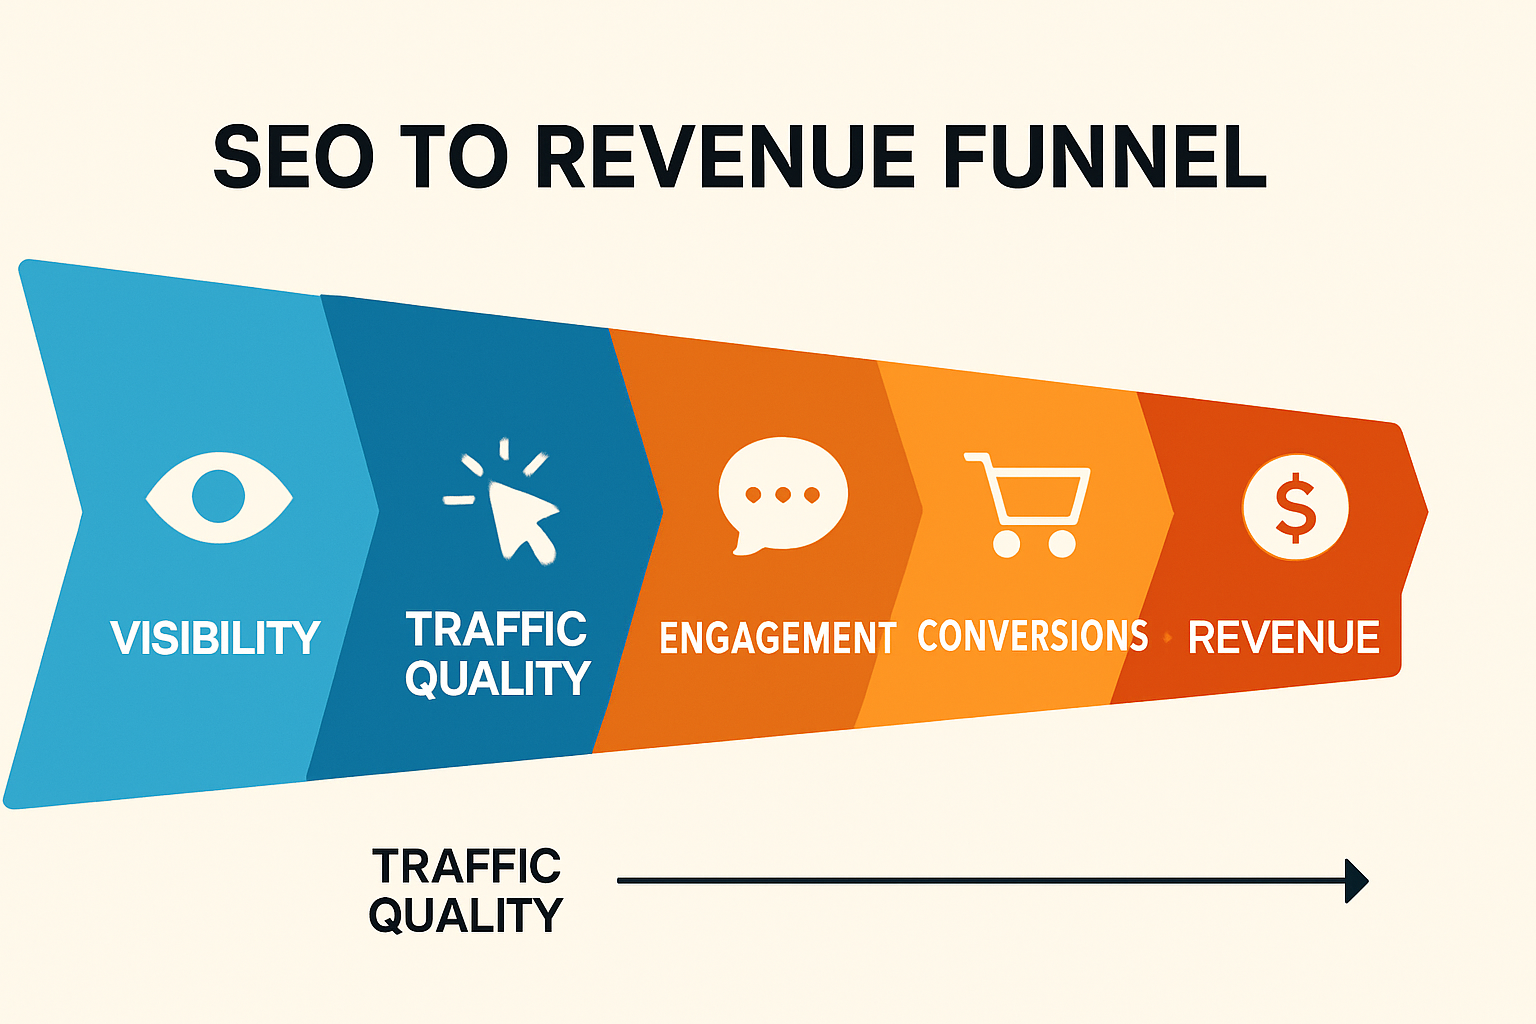
SEO has matured from “more traffic” to “more revenue, faster.” Yet many teams still report clicks and positions without showing how those outcomes fund the business. The fix is a revenue-first analytics approach that maps the full funnel, tracks meaningful conversions, and stitches SEO to CRM.
In this article, we’ll align SEO performance metrics with business goals, pick the right analytics SEO stack, and build a CFO-ready dashboard. Along the way, we’ll show how an AI platform like SEOsolved can accelerate content strategy so your analytics has something worth measuring.
What to measure across visibility, engagement, and revenue
Which SEO analytics software to use for each job
How to implement clean events, UTMs, and attribution
Forecasting methods to tie rankings to revenue
Define Revenue Outcomes and Map the Funnel
Start by clarifying revenue outcomes. For B2B: MQLs, SQLs, demos, pipeline, closed-won. For B2C/ecommerce: add-to-cart, purchase, AOV, LTV. Then define conversion events that represent these milestones and map how organic visitors progress through each step.
How to measure content performance effectively:
List business goals (leads, trials, demos, purchases).
Define primary conversions (e.g., trial start) and micro-conversions (e.g., pricing page view).
Assign values to conversions (more below) to quantify ROI.
Set attribution windows aligned to your sales cycle.
Connect web events to CRM objects for end-to-end visibility.
Data-backed revenue attribution lets you track progress on metrics like ROI, CLV/LTV, CAC, and pipeline efficiency—key indicators emphasized by revenue attribution research and best practices (MediaJel; HockeyStack).
The Essential SEO Performance Metrics That Predict Revenue
Definition: Revenue attribution is the discipline of linking SEO-driven sessions to conversions and dollars using defined events, lookback windows, and conversion values. It’s how you move from rankings to revenue.
Visibility & Demand: Impressions, Share of Voice, Rankings
These metrics indicate opportunity size. Use SEO keyword analytics to measure impression share and average position across high-intent queries. Rising visibility signals future pipeline if the terms align with monetizable intent.
Impressions and share of voice signal addressable demand.
Rankings by intent cluster forecast near-term traffic potential.
Non-branded visibility ties most directly to net-new revenue.
Traffic Quality: CTR, Clicks, New Users, Branded vs. Non‑Branded
Quality beats volume. Segment clicks and new users by non-branded queries. Monitor CTR and device mix to identify waste and misaligned titles. This view reduces unqualified traffic and lifts conversion likelihood.
CTR improvements compound traffic without more impressions.
Non-branded clicks predict net-new pipeline better than branded.
Landing page alignment with query intent drives downstream CVR.
On‑Site Engagement: Time on Page, Scroll Depth, CTA Clicks
Content engagement metrics reveal intent and readiness. Track scroll depth and CTA clicks by landing page to identify which pages advance users to conversion steps. Use web SEO analytics tools for friction detection and on-page optimization.
High scroll + low CTA clicks = strong content, weak offer or placement.
Low scroll + high bounce = misaligned intent or slow performance.
Conversion & Revenue: MQLs, Trials, Demos, Purchases, LTV
Translate conversions into revenue using values and LTV. For ecommerce, calculate revenue per visit (RPV). For SaaS/B2B, tie MQLs to pipeline and closed-won, then compute ROMI/ROAS.
Conversion-based value quantifies revenue from organic traffic (e.g., conversions × AOV). See examples in Search Engine Journal.
LTV-based valuation accounts for retention and repeat purchases (SEJ).
RPV quantifies actual money per visitor and complements CVR/AOV (Connect Media Agency).
Tooling Guide: Best SEO Analytics Tools by Job‑to‑Be‑Done
Here’s a practical stack—free and paid—to capture each metric layer and tie SEO to revenue without overspend. Leadership increasingly expects MQLs and revenue, not just rankings (Search Engine Land).
Free Baseline Stack: Google Search Console + GA4
Start with a free baseline: GSC for queries, impressions, CTR, and landing pages; GA4 for sessions, events, conversions, and revenue. Connect them so you can see which queries and pages drive conversions.
Map GSC queries to GA4 landing-page conversions.
Use GA4 Explorations for cohort and pathing analysis.
Enable enhanced measurement to capture scrolls and outbound clicks.
Resource: Build a reporting foundation with our guide on GA4 content dashboards.
Keyword & SERP Intelligence for Revenue Forecasts
Use rank tracking and SERP analysis to forecast non-branded traffic and conversions. Focus on intent-rich terms, featured snippets, and commercial pages. Trend ranking distributions and identify positions where CTR curves inflect.
Deep dive: see the Rank Tracker Tools: 2026 Buyer’s Guide and our overview of SEO tools in 2025.
Content Marketing Analytics Tools to Prove ROI
Attribute revenue to topics and pages using landing-page conversion reports, assisted conversions, and page value. This shows which content generates measurable business value beyond traffic (WebFX).
Learn how to measure content effectiveness end-to-end with our Content Marketing ROI Playbook and compare content intelligence platforms.
Behavior & CRO Insights from Web SEO Analytics
Use behavior analytics (e.g., heatmaps, session replays) to find friction and increase onsite CVR. Pair these findings with SEO landing pages to tighten intent alignment and improve funnel progression.
Data Layer & BI: Stitch SEO to CRM/Revenue
Blend data from GSC, GA4, and your CRM to see whether a search led to an MQL or closed-won deal (Search Engine Land). BI dashboards consolidate metrics like CLV, CAC, revenue per lead, and engagement rate (Shopify).
Want the strategy and content engine that your analytics can measure? Use SEOsolved to discover high-value topics and ship SEO-optimized articles in minutes—then track performance with your analytics stack. Start ranking today.
Job-to-be-done | Free option | Paid/advanced option | Key output |
|---|---|---|---|
Query & visibility | Google Search Console | Enterprise rank tracking | Share of voice, CTR by query |
Engagement & events | GA4 enhanced measurement | Tag manager + server-side | Scroll depth, CTA clicks, conversions |
Behavior & CRO | Lightweight heatmaps | Session replay & surveys | Friction insights, test ideas |
Revenue stitching | GA4 + CRM exports | BI warehouse & dashboards | MQLs, pipeline, LTV/CAC |
Implementation Blueprint: Events, UTMs, and Attribution
Follow this step-by-step plan to capture clean SEO data, separate channels, and attribute revenue accurately.
Define Primary Conversions and Monetary Values
Agree on 1–3 primary conversions (trial start, demo request, purchase).
Assign values: use AOV or revenue per lead; for B2B, multiply by lead-to-close rates.
Set lookback windows appropriate to your sales cycle.
Document definitions to align exec and practitioner reporting.
This aligns with ROI-focused SEO where you track traffic, conversions, and revenue before optimizing allocations.
Configure GA4 Events, Parameters, and Enhanced Measurement
Enable enhanced measurement (scrolls, outbound clicks, site search).
Create events for CTA clicks, form submits, trial starts, purchases.
Send parameters for landing page, content group, and lead value.
Mark conversion events and verify in GA4 DebugView.
Connect Search Console to Analytics and Annotate Changes
Link GSC to GA4 to blend query/ranking with conversion data.
Maintain an annotation log for content releases and experiments.
Review cause-and-effect weekly to spot impact windows.
UTM Governance: Separate Organic SEO from Other Channels
Standardize source/medium naming and lock with a UTM builder.
Block UTMs on internal links; use campaign-only for cross-promo.
Audit landing pages for misattribution and fix redirect chains.
CRM Stitching for Down‑Funnel Revenue (B2B/B2C)
Sync GA4 user and session IDs to CRM where compliant.
Attribute MQLs, opportunities, and revenue back to landing pages.
Track organic traffic to MQL rate, SQL rate, and closed-won revenue (Connect Media Agency).
QA and Data Reliability Checklist
Validate event fires and parameters weekly in DebugView.
Compare GA4 vs. backend revenue for tolerance thresholds.
Spot-check GSC query sampling for top pages.
Document changes; re-test after tag or site updates.
Build a Revenue‑First SEO Dashboard
Design a CFO-ready dashboard that tracks the few metrics that matter and updates weekly. Focus on non-branded performance, conversion flow, and revenue contribution. A single source of truth prevents channel cannibalization and last-click bias.
KPI Shortlist Executives Care About
Non-branded clicks → landing page conversion rate (CVR) → trials/MQLs
Pipeline and revenue attributed to organic
ROMI/ROAS, LTV/CAC, and revenue per visit (RPV)
Trend annotations to show cause vs. correlation
Dashboard Architecture and Data Sources
Inputs: GSC (queries), GA4 (events, revenue), CRM (pipeline), experiments log.
Transform: map landing pages to topics and funnel stages.
Outputs: KPI tiles, page-level revenue tables, opportunity lists.
For a reference build, see our guide to a GA4 content dashboard. Multi-channel attribution helps reveal SEO’s assist value across the journey (MediaJel).
Operating Cadence: Weekly Reviews and Actions
Review KPI tiles and annotate anomalies.
Prioritize top opportunities by expected revenue lift.
Ship experiments (titles, internal links, CTAs, new content).
Report outcomes with context and next actions.
Forecasting: Tie Rankings to Revenue with Conversion Math
Turn ranking goals into revenue targets using conservative CTR and CVR assumptions. Predictive analytics will increasingly help teams anticipate trends and create content ahead of demand (LSEO).
Opportunity Sizing from Keyword Data
Estimate monthly clicks by position using realistic CTR curves.
Weight by non-branded volume to focus on net-new demand.
Multiply by landing page CVR and AOV/LTV to estimate revenue.
Scenario Modeling and Sensitivity Analysis
Model outcomes across positions and conversion rates to set targets and confidence ranges. Include pessimistic, base, and aggressive scenarios so expectations align with reality.
Proving Lift vs. Trend: Experiments and Annotations
Differentiate causation from correlation with controlled tests and a release log. Use holdout pages, staggered internal links, and pre/post analyses. Keep a tight annotation trail of edits, deployments, and algorithm updates.
Measure Content Marketing ROI: A Step‑By‑Step Playbook
Use this repeatable process to attribute revenue to articles and clusters. For fundamentals on page-level tracking, see the section on measuring SEO ROI and our in-depth ROI playbook.
Map Articles to Customer Jobs and Funnel Stages
Assign each article a job-to-be-done and stage (awareness → purchase).
Align CTAs to stage (newsletter, trial, demo, purchase).
Group pages into intent clusters for roll-up reporting.
Attribute Leads and Sales to Specific Blog Posts
Use landing-page conversion reports for last-touch revenue.
Track assisted conversions to credit influence across paths.
Map content clusters to pipeline for executive summaries.
Calculate Page‑Level ROI and Prioritize Updates
Compute page revenue (last-touch + assists) and page costs.
Rank by ROI and revenue per 1,000 visits to find leverage.
Prioritize updates: title/intro hooks, internal links, offer fit.
Common Pitfalls (and How to Fix Them)
Last‑Click Bias and Misattribution
SEO often assists earlier in the journey. Use multi-touch and time-decay models to see assist value across channels (MediaJel).
Missing Events and Weak Conversion Definitions
Track the actions that actually predict revenue—trial start, demo request, qualified lead—not vanity metrics. Revisit definitions quarterly and validate with sales.
Dirty Channel Taxonomy and UTM Drift
Inconsistent source/medium naming breaks reporting. Standardize UTMs, block internal UTMs, and audit regularly. A clean taxonomy protects decision quality.
How SEOsolved Accelerates Revenue‑Focused SEO
SEOsolved complements your analytics stack by creating a high-impact content strategy and generating SEO-optimized articles that feed measurable revenue pipelines.
From Research to Roadmap in Minutes
Analyzes competitors and discovers hundreds of ranking keywords.
Builds a tailored content roadmap focused on high-value opportunities.
Finds content gaps tied to profitable topics you’re missing.
Result: a prioritized plan that aligns with your SEO keyword analytics and revenue targets—so your dashboards light up with meaningful gains.
Publish SEO‑Optimized Articles with Credible Sources
Generates high-quality, SEO-optimized content ready to rank on Google, ChatGPT, and other search engines.
Pulls credible references to boost E-E-A-T and trust.
Ships in as little as 30 minutes so you can test faster.
Workflow: Plan, Publish, Measure
Plan your roadmap with SEOsolved.
Publish optimized articles and landing pages.
Measure with your SEO analytics tools and dashboards.
Ready to turn strategy into measurable revenue? Start ranking today.
Action Plan and Checklist
Use this checklist to implement your stack, launch dashboards, and tie SEO to revenue.
Set goals, define conversions, assign values (AOV, LTV).
Implement GA4 events and link GSC; verify in DebugView.
Build dashboard: non-branded clicks → CVR → pipeline → revenue.
Adopt UTM governance; audit for misattribution monthly.
Stitch to CRM; report MQLs, opportunities, closed-won.
Forecast revenue from target rankings and scenario ranges.
Ship content weekly; annotate every release and test.
Review ROMI quarterly; reinvest in top-performing topics.
Get Started
By shifting to a data-driven, automated approach, you can connect SEO performance directly to visibility, engagement, pipeline, and revenue (Siteimprove). Put this blueprint into action with a roadmap and content engine your dashboards can measure. Then iterate weekly, model outcomes, and prove ROI.
Want a faster path to results? Pair this analytics setup with SEOsolved and publish a full, revenue-first content plan in minutes. Start ranking today.
FAQ
What are the most important SEO performance metrics for revenue?
Non-branded clicks, landing page CVR, trials/MQLs, pipeline, and revenue per visit. Pair with LTV/CAC for ROI and time-decay attribution for assists.
Which free SEO analytics tools should I start with?
Google Search Console for queries and visibility, and GA4 for events, conversions, and revenue. Link them and enable enhanced measurement.
How do I measure content effectiveness beyond traffic?
Track scroll depth, CTA clicks, conversions, and page-level revenue (last-touch plus assists). Roll up by topic cluster to prioritize updates.
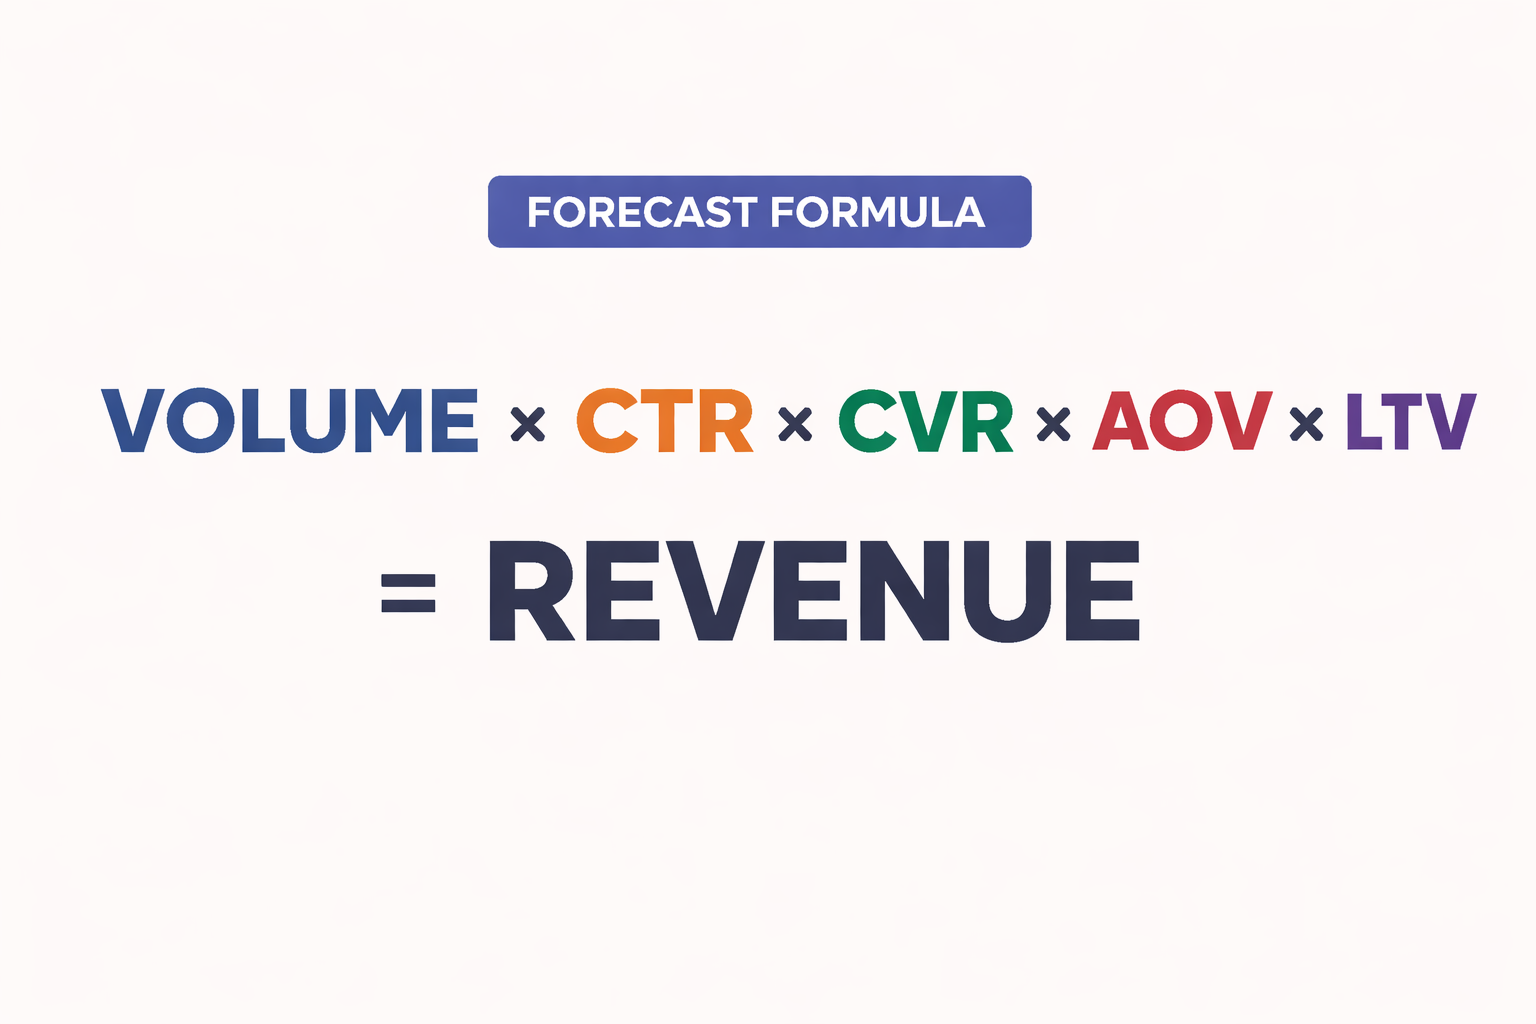
How do I forecast revenue from rankings?
Use volume × CTR by position × CVR × AOV/LTV. Model pessimistic, base, and aggressive scenarios to set realistic targets.
How can I prove SEO’s impact to executives quickly?
Build a dashboard that shows non-branded clicks to revenue, annotate releases, and report pipeline and closed-won attributed to organic.